

The company faced several challenges in its production lines, mainly related to:
Faced with these challenges, we designed and implemented the FORSEN Project, with a comprehensive approach that encompasses sensorization, artificial intelligence, product traceability, digitized quality control and analytical dashboards.
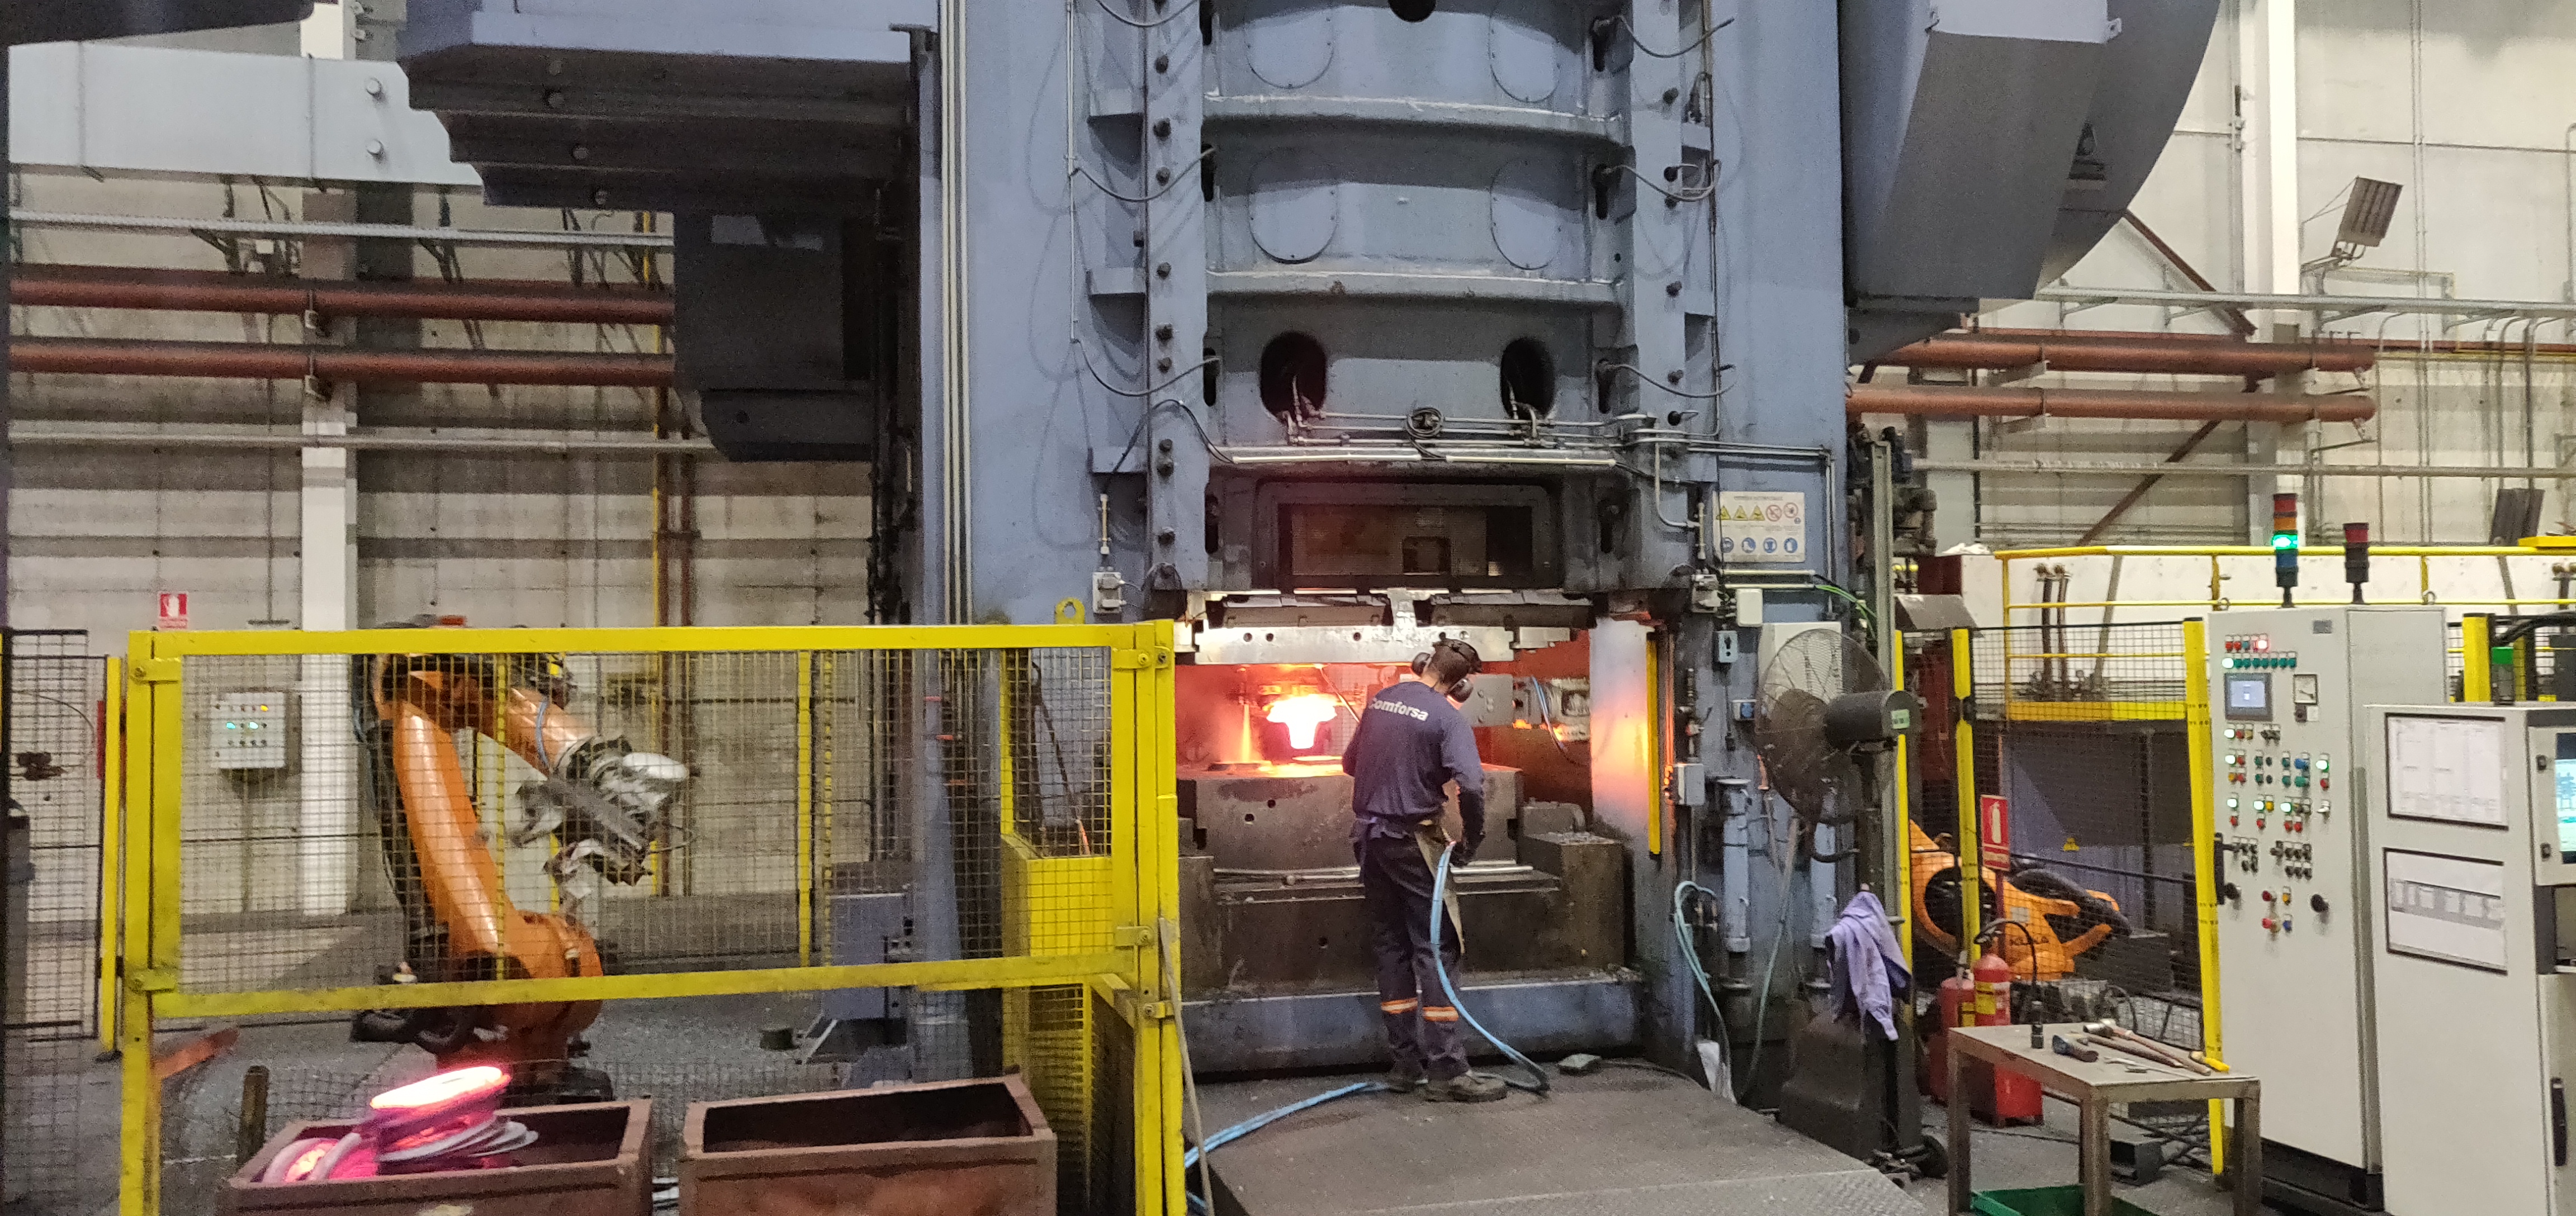
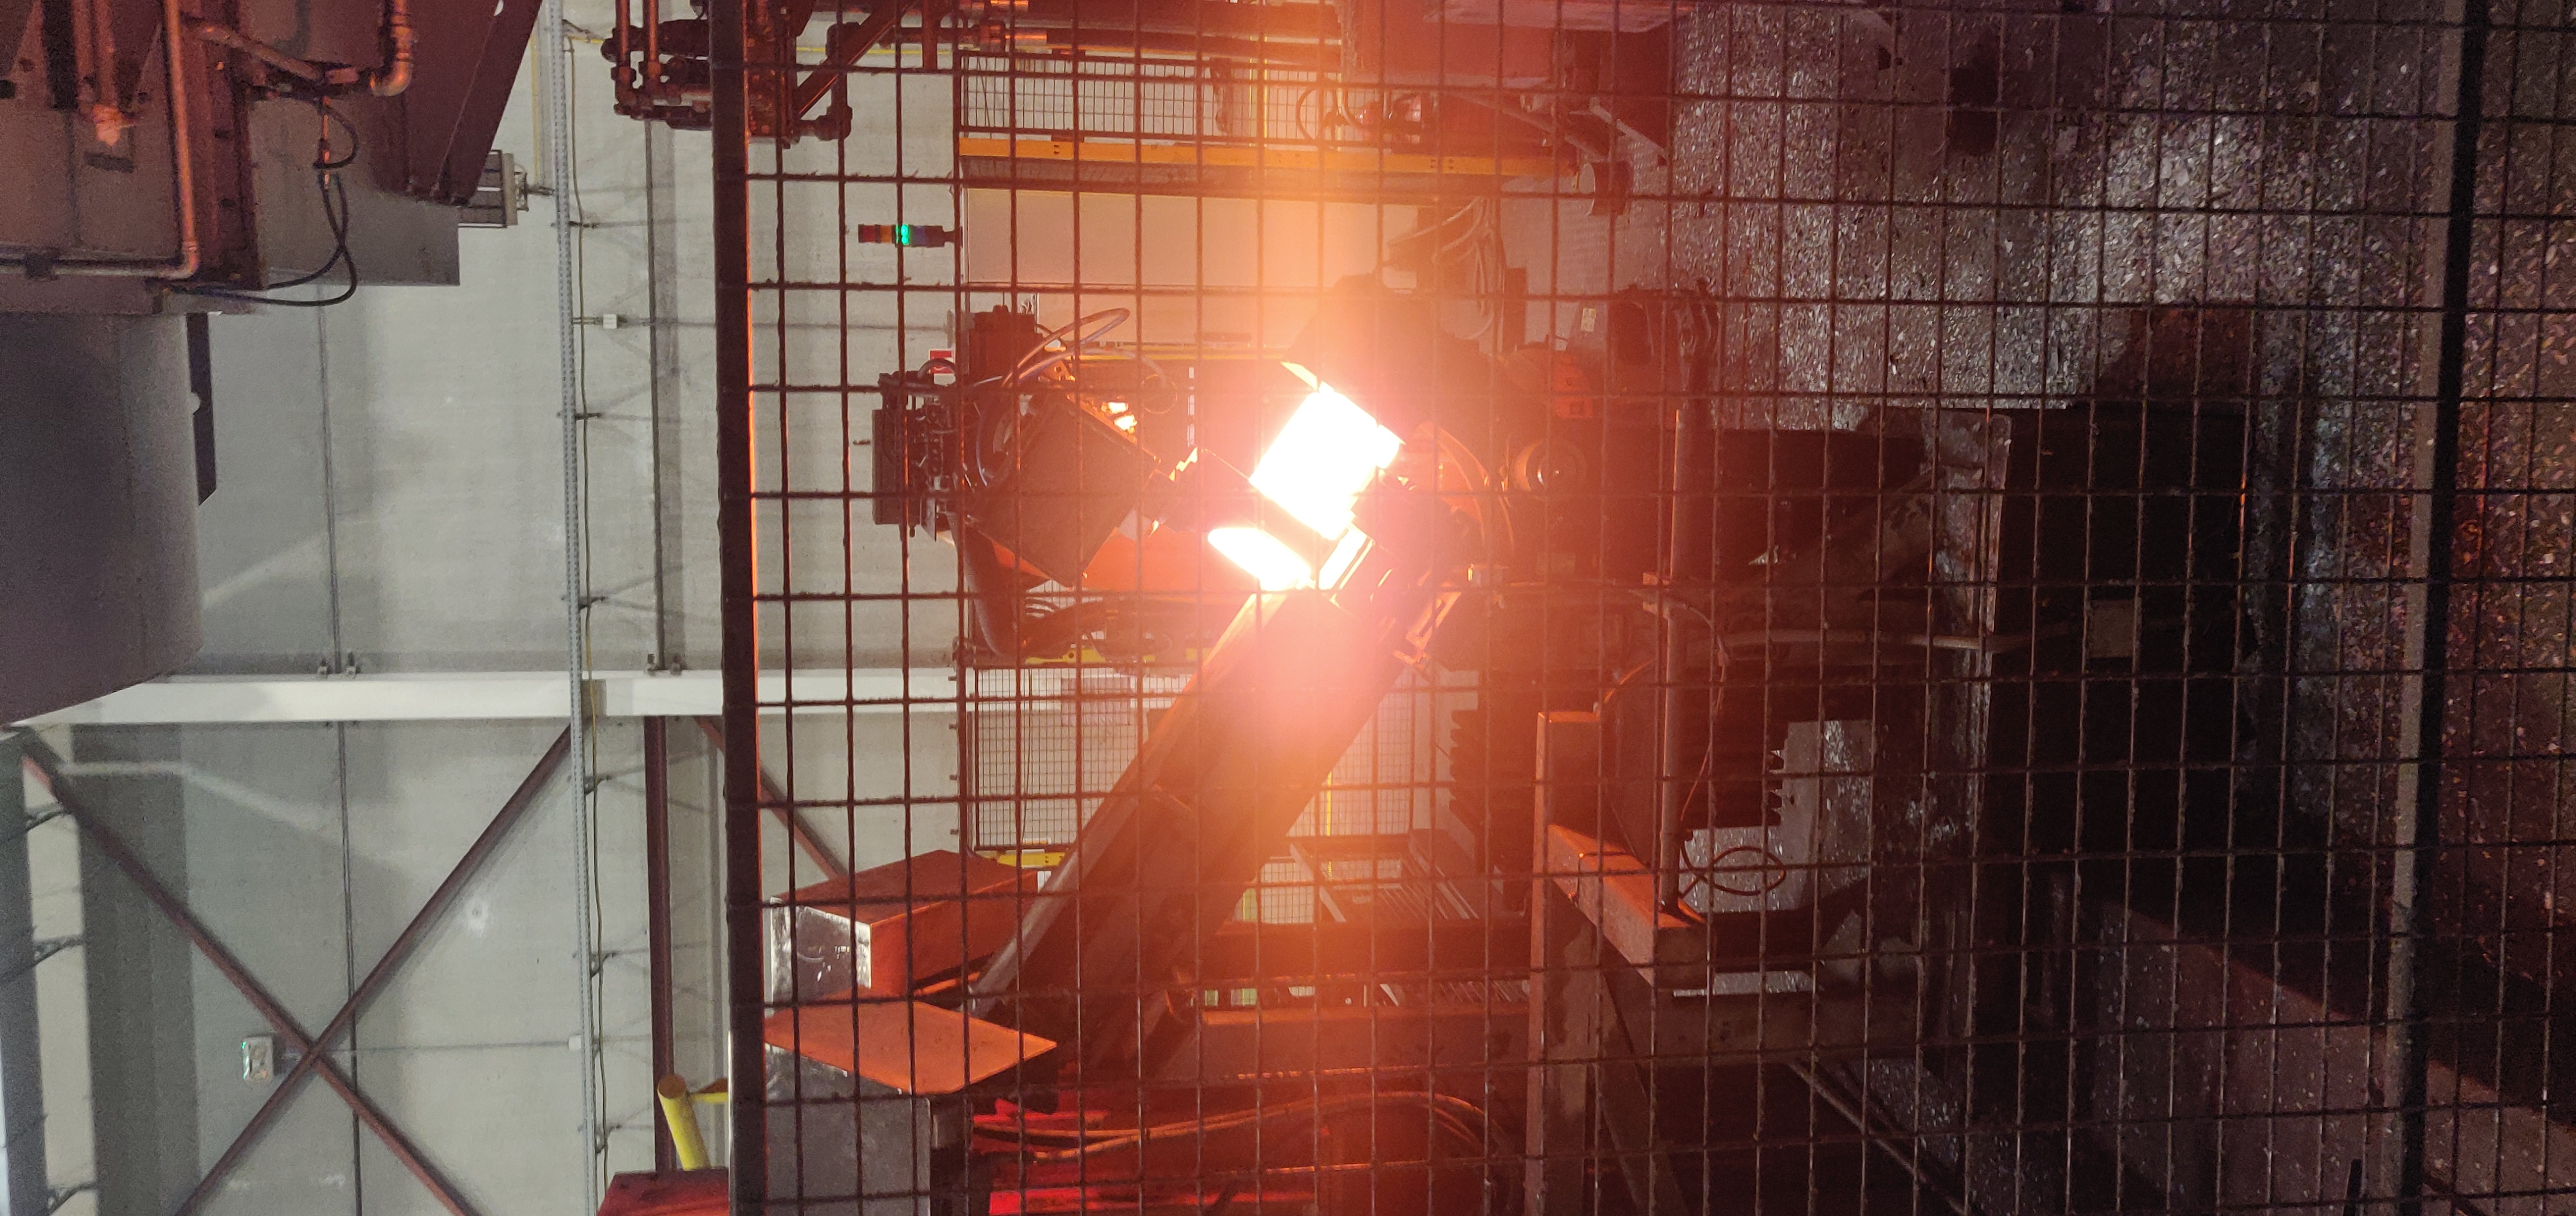
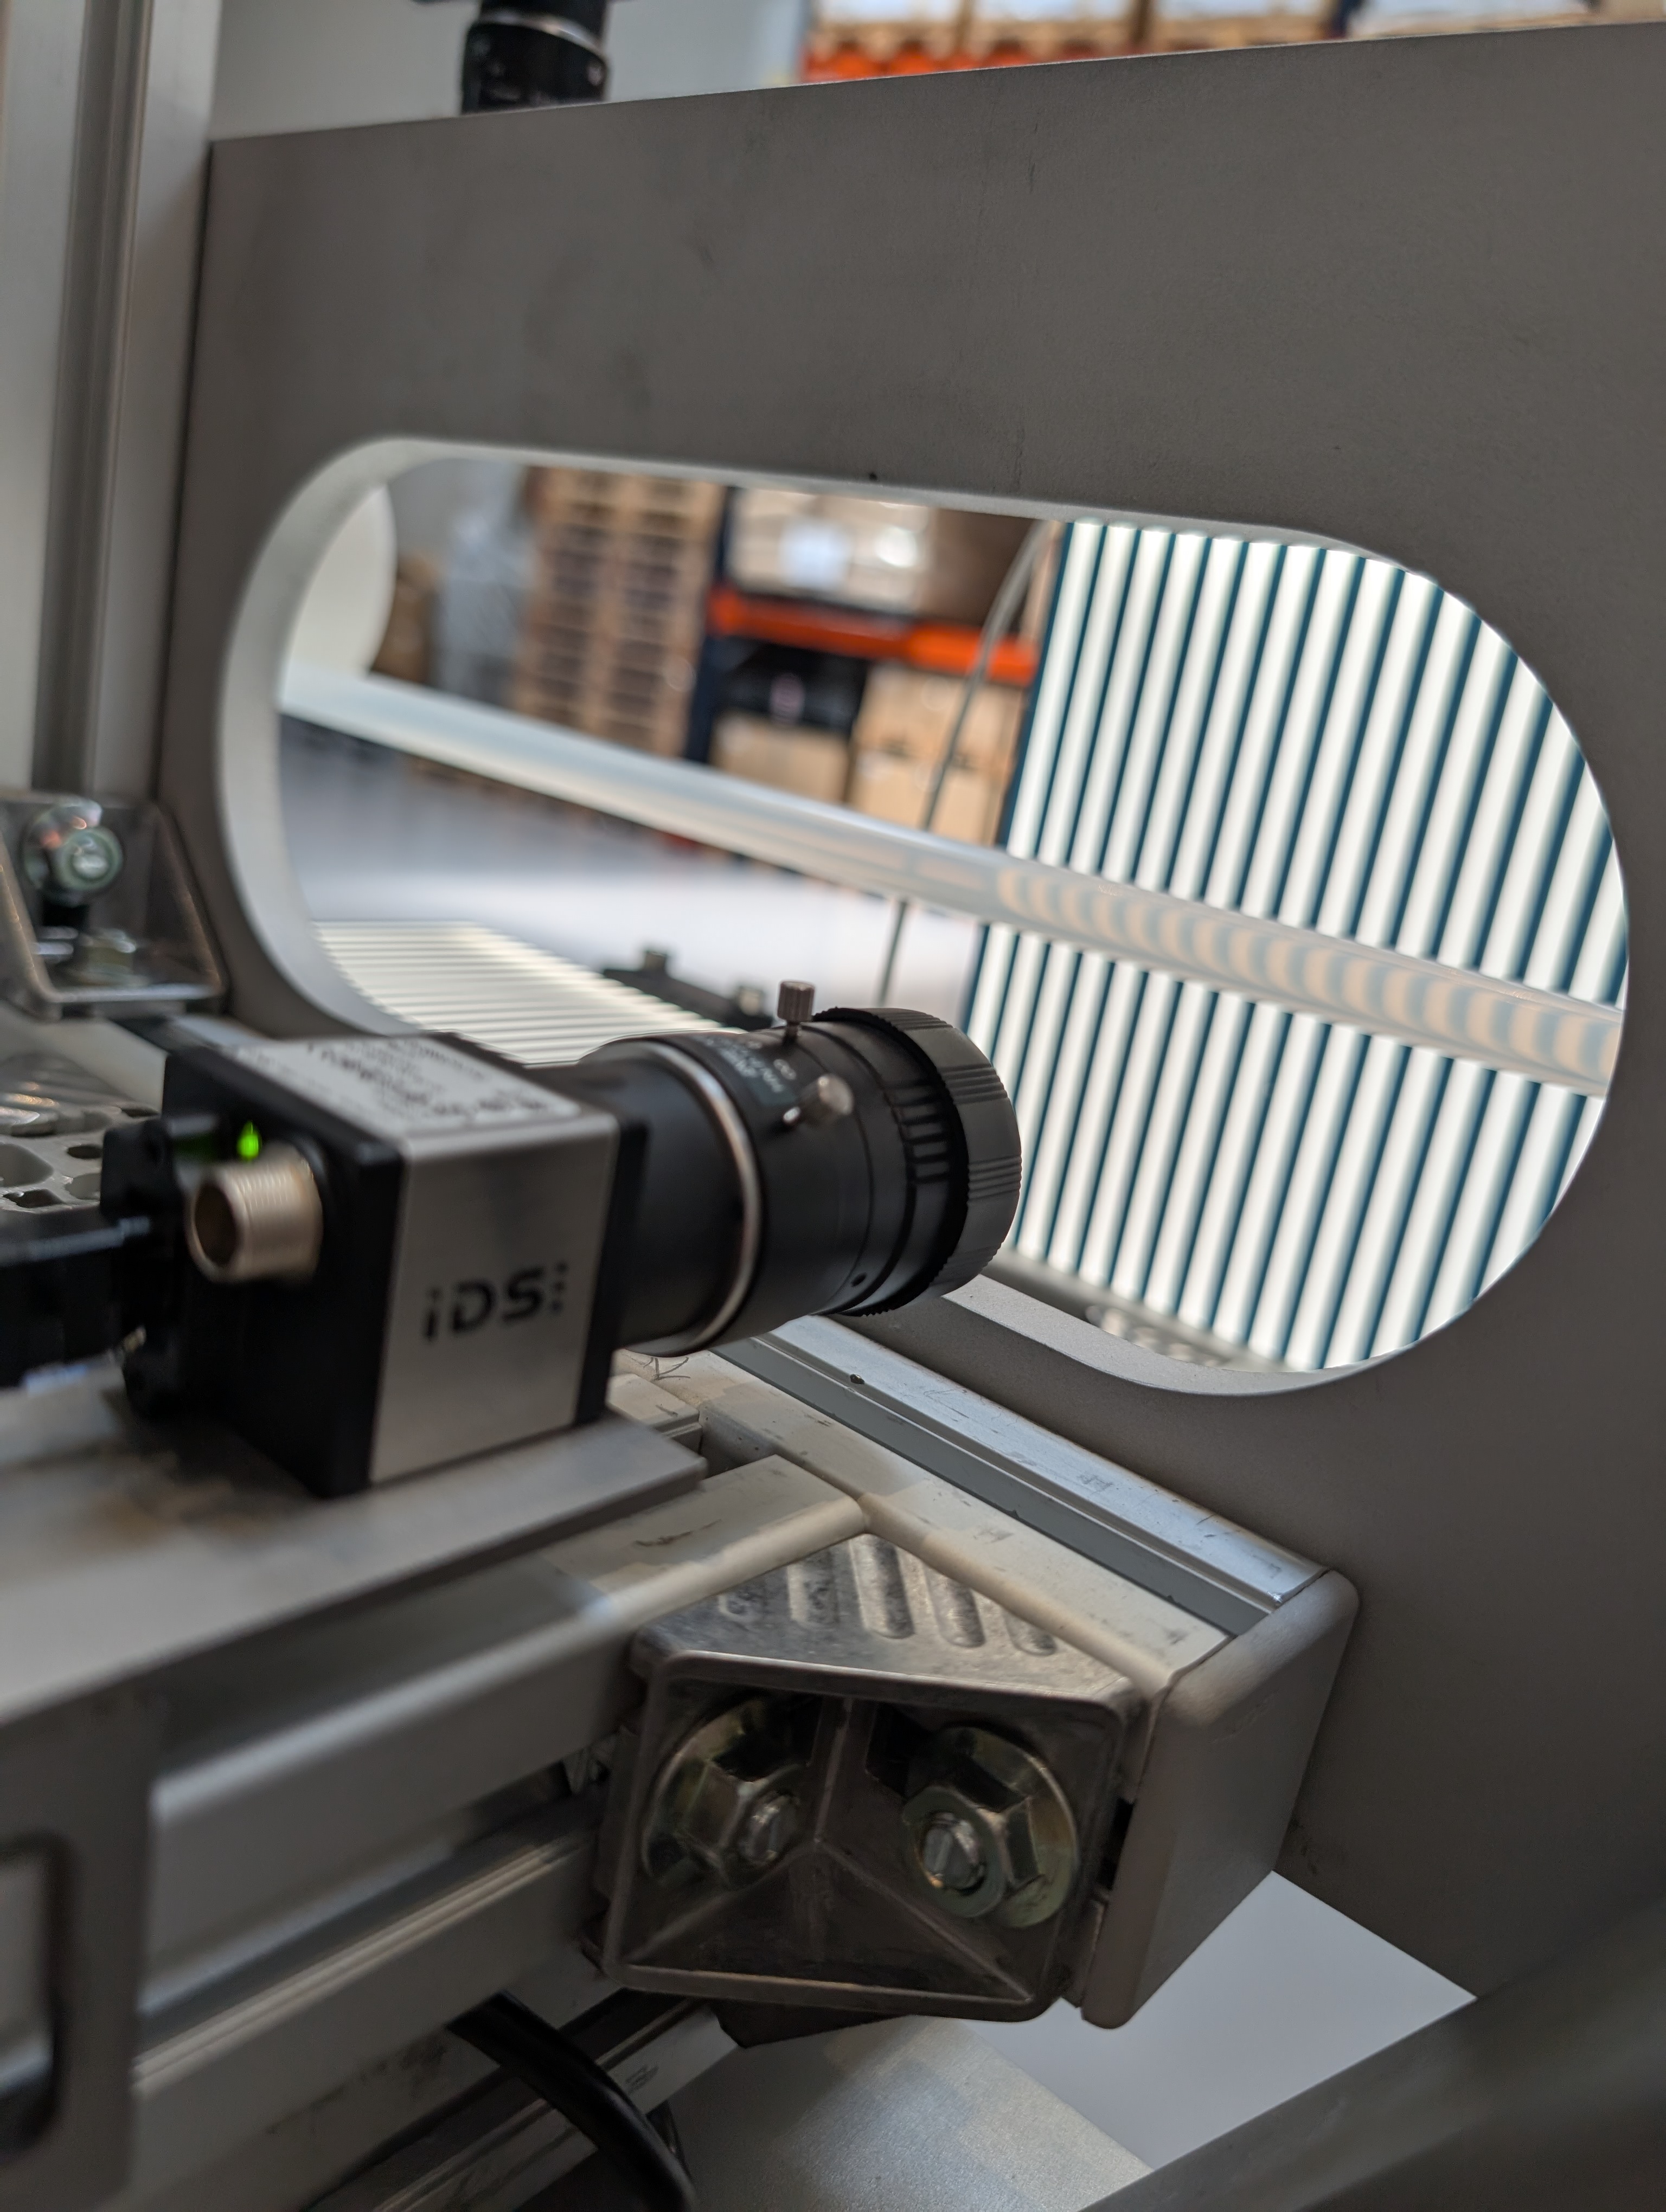
Various sensors and devices were incorporated, including the installation of a thermographic camera, whose main functionality is to monitor in real time the temperature of the matrices at different stages of the process (stress, first, preform and second).
This system allows the configuration of specific thermal control zones, with management of presets according to the processed reference. Emphasis is placed on maintaining the cleanliness of the lens, due to the sensitivity of color measurement.
Each piece is uniquely identified, which enables full traceability from its passage through the cooling tunnel to its integration into boxes, including:
The quality control procedure was systematized so that each scanned box goes through a defined process, including:
The system provides control histories, visualization of attributes out of range, and advanced filtering by date, matrix, casting and manufacturing.
A system was implemented to automatically record and analyze downtimes. Two types are defined:
These events are reported on a web platform for the operator to enter the reason, the causing equipment, the fault and observations. The tool generates downloadable graphics with the production sheet, showing the relationship between operability and volume of parts produced.
Two main panels were developed:
The implementation of the FORSEN Project has generated significant improvements in different areas:
The FORSEN case shows how digitalization and the integration of advanced technologies — such as sensing, traceability, artificial intelligence and data analysis — can profoundly transform industrial operations. The solution has allowed a substantial improvement in efficiency, quality control and the ability to anticipate possible failures, consolidating a technological base for continuous improvement and operational excellence.
Datos Procesados
Volumen de datos procesados por la solución en el proceso de entramiento y producción.
Mejora de EGP
Mejora de la eficiencia global productiva del proyecto. Métrica que impacta a la rentabilidad de planta.
Accuracy de los modelos.
La unidad de medida que empleamos para medir la precisión de nuestros modelos y soluciones.
The company faced several challenges in its production lines, mainly related to:
Faced with these challenges, we designed and implemented the FORSEN Project, with a comprehensive approach that encompasses sensorization, artificial intelligence, product traceability, digitized quality control and analytical dashboards.
Various sensors and devices were incorporated, including the installation of a thermographic camera, whose main functionality is to monitor in real time the temperature of the matrices at different stages of the process (stress, first, preform and second).
This system allows the configuration of specific thermal control zones, with management of presets according to the processed reference. Emphasis is placed on maintaining the cleanliness of the lens, due to the sensitivity of color measurement.
Each piece is uniquely identified, which enables full traceability from its passage through the cooling tunnel to its integration into boxes, including:
The quality control procedure was systematized so that each scanned box goes through a defined process, including:
The system provides control histories, visualization of attributes out of range, and advanced filtering by date, matrix, casting and manufacturing.
A system was implemented to automatically record and analyze downtimes. Two types are defined:
These events are reported on a web platform for the operator to enter the reason, the causing equipment, the fault and observations. The tool generates downloadable graphics with the production sheet, showing the relationship between operability and volume of parts produced.
Two main panels were developed:
The implementation of the FORSEN Project has generated significant improvements in different areas:
The FORSEN case shows how digitalization and the integration of advanced technologies — such as sensing, traceability, artificial intelligence and data analysis — can profoundly transform industrial operations. The solution has allowed a substantial improvement in efficiency, quality control and the ability to anticipate possible failures, consolidating a technological base for continuous improvement and operational excellence.
Datos Procesados
sit amet in order consectetur. Condimentum mi consequat eget.
Datos Procesados
sit amet in order consectetur. Condimentum mi consequat eget.
Datos Procesados
sit amet in order consectetur. Condimentum mi consequat eget.
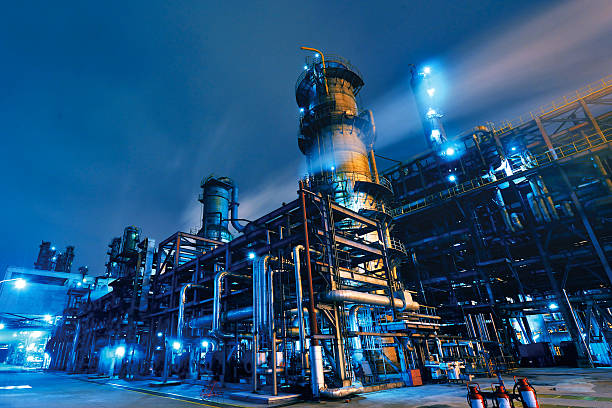
Project for the detection of defects in the manufacture of food products by vision.

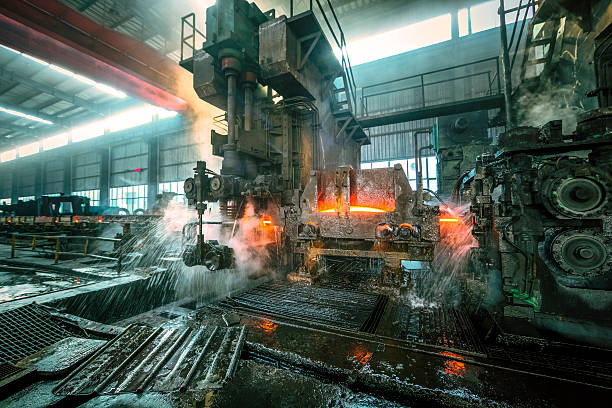
Prediction of future unplanned shutdowns due to breakages of critical industrial machinery.

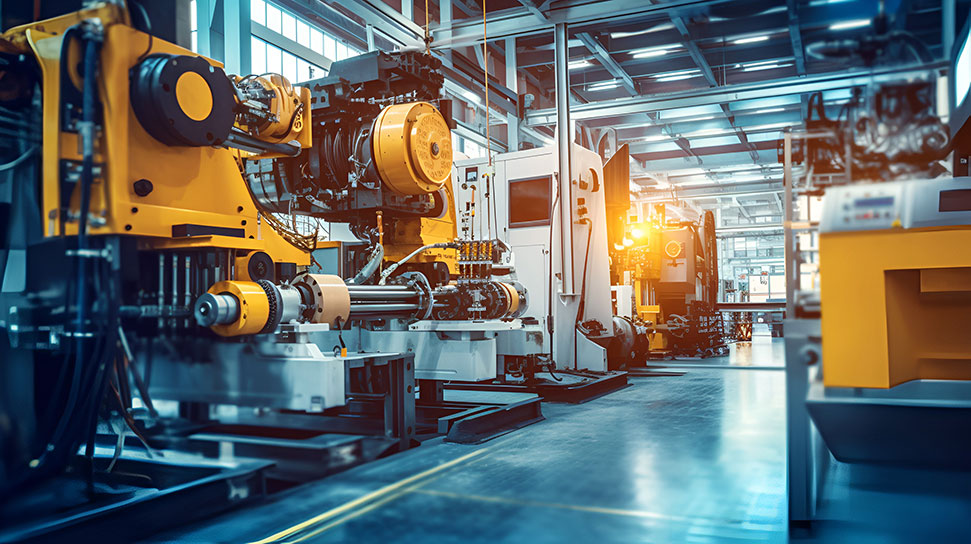
Predictive modeling and optimization of performance and efficiency based on operating conditions.

Project for the detection of defects in the manufacture of food products by vision.
.png)
Prediction of future unplanned shutdowns due to breakages of critical industrial machinery.

Predictive modeling and optimization of performance and efficiency based on operating conditions.

Lorem ipsum color sit amet, consectetur adipiscing elite. Suspended Varius Enim in Eros Elementum Tristique. Duis cursus, mi quis viverra ornare, Eros Dolor Interdum Nulla,


Lorem ipsum color sit amet, consectetur adipiscing elite. Suspended Varius Enim in Eros Elementum Tristique. Duis cursus, mi quis viverra ornare, Eros Dolor Interdum Nulla,
Lorem ipsum color sit amet, consectetur adipiscing elite. Suspended Varius Enim in Eros Elementum Tristique. Duis cursus, mi quis viverra ornare, Eros Dolor Interdum Nulla,


.png)
.png)
.png)